Contrary to popular belief, it seems that the British economy isn’t performing too badly since the results of the EU referendum were announced back in June.
In fact, official figures released this week show that our economy is growing at a faster rate than many experts had predicted at this stage of the year. Third quarter growth currently stands at +0.5%, nearly double the +0.3% majority forecast.
Which industries are contributing to this growth?
By far the most dominant sector, the services sector – which includes transport, storage and communications – grew by +0.8% in the third quarter.
However, this is largely isolated growth that compensates for the fact that nearly all other major sectors shrank in Q3. As expected, construction fell sharply by -1.4%as we enter the winter season, while manufacturing and agriculture also contracted.
Although no official figures have been released on consumer spending, it’s highly likely that incredibly low interest rates and a weakened pound went some way to encourage overseas spending and investment for UK goods and services.
So, was Brexit the right call?
It’s still far too early to tell. Both ‘Leave’ and ‘Remain’ voters will argue that these findings support their respective points of view.
Of course, Brexit supporters are likely to view these figures as a sign that any warnings about a potential economic downturn were largely unfounded, and that Britain is in fact, benefitting from the decision to leave the EU.
However, those who voted to remain in the EU would argue that it is the drastic action taken by the Bank of England to encourage spending that has salvaged economic growth – and that any promises of sustained growth will soon be dampened as we enter 2017.
For the time being, both opinions are somewhat speculative and, given the fact that many economic experts failed to predict the current level of growth, we still cannot be sure of either the long-term or the short-term impact economic consequences of the Brexit vote.
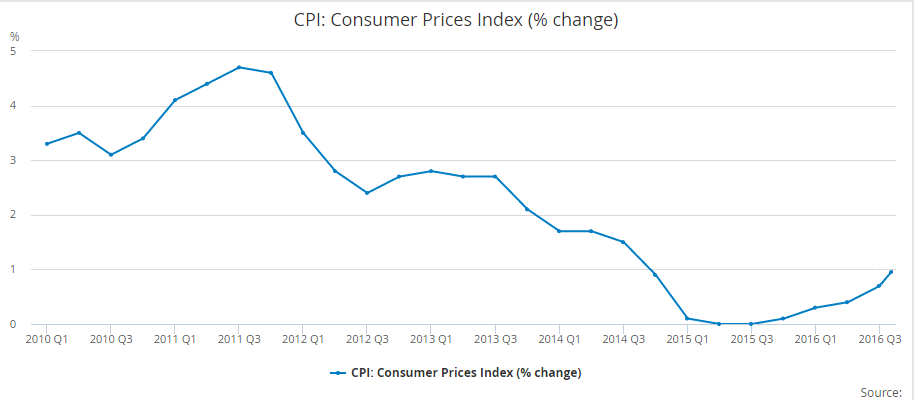
UK inflation rose to 1% in September, up from the 0.6% rate reported in August. The figures, released this week by the Office of National Statistics (ONS), also show that we’re currently at our highest annual rate of inflation since 2014.
Inflation explained
The ONS measures inflation using the Consumer Price Index (CPI), which is basically the rate at which the average shopping basket has increased or decreased over the past year. This basket includes goods and services such as food, housing, clothing, transportation, education and medical care, to name a few.
Right now, the cost of the average shopping basket is rising at a faster rate than we’ve seen in recent years. But bear in mind that, historically, our current level of inflation remains very low, especially when compared to the heights of 5% in 2011. This could indicate there’s still room for inflation to increase further in the coming year.
The below graph shows the trend of UK inflation over the past six years.
What exactly is causing the current rise?
If we take a closer look at our average shopping basket, there are a few notable contributors. Clothing and footwear prices have jumped up, as is the norm around the winter months, while the cost of fuel, hotels and restaurants has also increased. Governor of the Bank of England, Mark Carney, predicts food prices will soon rise too.
Experts say that the falling value of the pound – down by 18% against the dollar since Brexit – hasn’t had a major impact on inflation yet, though it is likely that this impact will push prices up further before too long.
Unfortunately, they also predict that poorer families will be hit hardest by the rise, due mainly to the fact that benefits are frozen at the moment and will not rise in line with CPI. As a result, these families will lose a bigger portion of their disposable income, as much as £100 per year according to the Institute for Fiscal Studies.
The average house buyer in the UK now requires six times the amount of their yearly income to secure a home, according to latest official figures from the Office of National Statistics (ONS).
This confirms that house prices have risen at a far quicker rate than average earnings over the past decade. In fact, the ONS found that house prices have risen by as much as 88% – from £110,000 in 2002, to £207,500 in 2015. Compare that to average earnings increase during the same period – £26,000 in 2002, to £32,780 in 2015.
It’s easy to see the disparity between these two sets of growth, but it’s also worth bearing in mind the two ends of this spectrum because the average figures alone don’t quite tell the whole story.
The most and least affordable places to live in the UK
The ONS data actually showed that in a third of local authorities across the country, house prices had actually reached more than 10 times salary earnings, with the biggest gaps unsurprisingly found in London and the south-east.
Regional differences show that Burnley is the most affordable place to live in the UK; whereas Westminster ranks as the least affordable. The median house price in Burnley is a mere 3.6 times the median salary, compared to 23 times the median salary in Westminster.
The ONS report is perhaps our most recent evidence that the North/South divide is still very much in effect in the housing market.
Tough times for all buyers, not just first-timers
The theme of first-time buyers struggling to secure their first step on the property ladder is well-known. It’s now becoming more and more obvious that homeowners and renters across the country are losing a bigger slice of their income to the cost of accommodation, particularly those on the move.
And although there has been some movement from the government to increase housing provision throughout the country, many experts maintain that the UK is still far off the number of houses needed to make housing as affordable as it was ten years ago.
Representative 28.96% APRC (Variable)
For a typical loan of £26,600 over 180 months with a variable interest rate of 19.56% per annum, your monthly repayments would be £484.00. This includes a Product Fee of £2,660.00 (10% of the loan amount) and a Lending Fee* of £763.00, bringing the total repayable amount to £87,030.00. Annual Interest Rates range between 11.7% to 46.5% (variable). Maximum 50.00% APRC. *Lending Fee varies by country: England & Wales £763, Scotland £1,051, Northern Ireland: £1,736.
Think carefully before securing debts against your home may be repossessed if you do not keep up repayments on your mortgage or any other loan secured against it. If you are thinking of consolidating existing borrowing, you should be aware that you may be extending the terms of the debt and increasing the total amount you repay.


