In what is now an annual tradition, leading comparison website Which? have announced their definitive UK supermarket rankings.
The results follow a nationwide survey in which over 7,000 shoppers from across the country were quizzed on a broad range of customer satisfaction measures, both in store and online.
The best
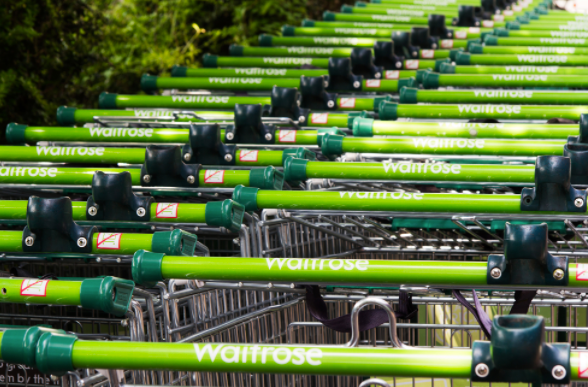
Renowned upmarket grocer Waitrose topped the overall in-store experience for the third year running, coming in with a customer score of 74% overall. That said, Waitrose were only marginally ahead of both Marks & Spencer and, perhaps surprisingly, Aldi.
But while both Waitrose and Marks & Spencer gained plaudits for their spacious store layouts and helpful staff, Aldi was highly commended for its fantastic value for money and quality own-brand products. Aldi’s prominence also indicates that the average price of goods was a major factor this year.
Meanwhile, Iceland ran away with top spot in the online supermarket rankings with 77% customer satisfaction, another surprise.
The Worst
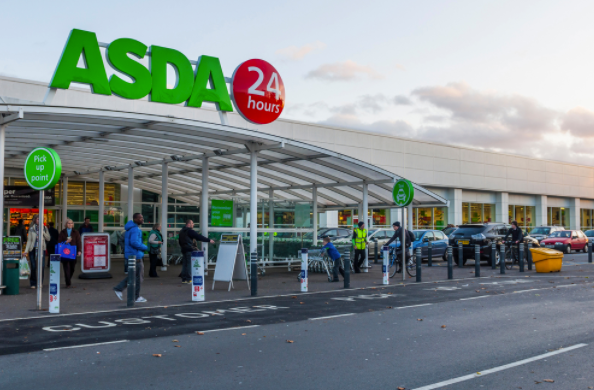
On the other end of the scale, Tesco, Sainsbury’s and particularly Asda suffered poor in-store scores in comparison. This was largely down to the unavailability of popular items and average food quality compared with other supermarkets.
Asda also ranked joint bottom of the online rankings, along with Sainsbury’s and Waitrose. All things considered, it doesn’t look like it’s been the best year for the bigger supermarket names, with many people seeming to seek an alternative option for their weekly shop.
The results in full
Waitrose – 74% in-store/71% online
Iceland – 69% in-store/ 77% online
Marks & Spencer – 73% in-store only
Aldi – 72% in-store only
Lidl – 72% in-store only
Morrisons – 70% in-store/74% online
Sainsbury’s – 67% in-store/ 71% online
Tesco – 66% in-store/74% online
Asda – 62% in-store/71% online
Ocado – 76% online only
This week, Communities Secretary Sajid Javid announced the UK Government’s plans to revitalise the UK housing market, stating that the current system is ‘broken’.
But what makes Javid’s plans any different to that of his predecessors? It’s a fair question given that housing has been somewhat of a perennial problem facing the Government for the past thirty years. In fact, the challenge of home ownership has never seemed more daunting, particularly for first-time buyers.
In an interview with Sky News, Javid unveiled plans to support small construction firms in their goal to build more houses. A £3bn loan fund is now in place to help these firms build more than 25,000 new houses by 2020, and up to 225,000 in the long term.
Fixing our broken housing market
Today the average house costs almost eight times the average person’s annual earnings – an all-time record in the UK. Such a high housing cost is a significant barrier to social progress, savings and disposable income, especially for the ordinary worker living in Britain.
The government plans for housing are laid out in full in a long-awaited white paper entitled Fixing Our Broken Housing Market. The report is available to download here.
However, Labour have already begun to question these plans in Parliament, with housing spokesman John Healey MP questioning whether this statement of intent is enough to solve the housing crisis faced by millions of people.
It does seem to be a step in the right direction, at least, but is it enough?
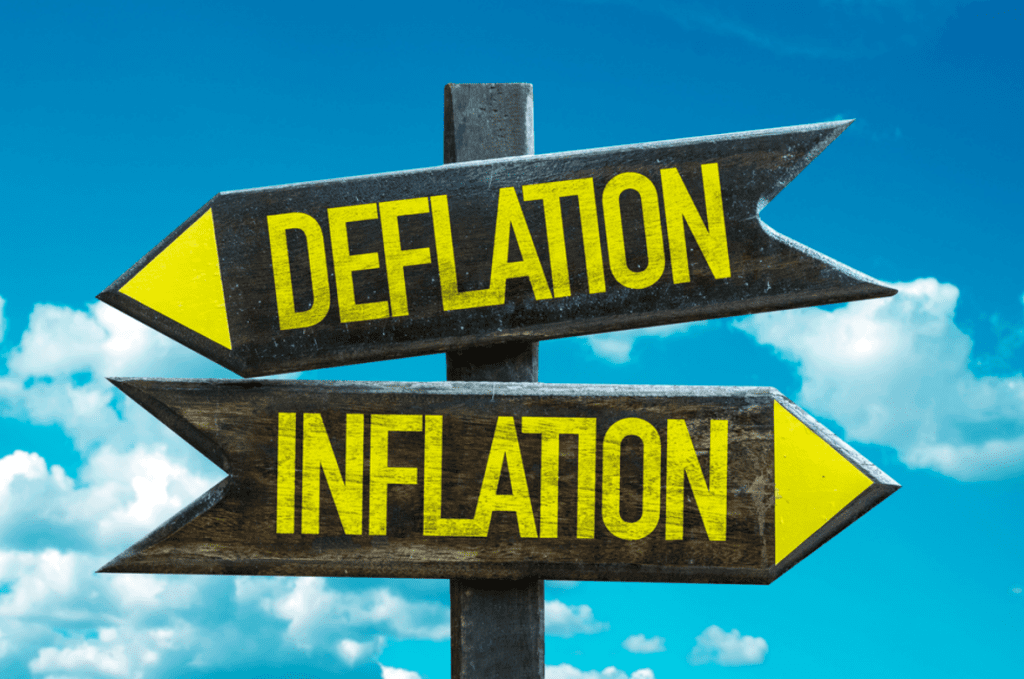
This week, the Bank of England made its annual growth forecast for the year ahead, stating that we can expect 2% economic growth over the course of 2017 – a figure that’s bang in line with the government’s inflation target.
While that’s all well and good, what does it actually mean for our standard cost of living, and what has been happening with market prices over the past 12 months?
The key thing to weigh this rise inflation against is the change in average living wage over the same time period. Now, the average wage is just over £28,000, up from £27,600 in 2015, which indicates an increase of approximately 1.5%.
source:https://www.ons.gov.uk/employmentandlabourmarket/peopleinwork/earningsandworkinghours/bulletins/annualsurveyofhoursandearnings/2016provisionalresults
This would lead us to believe that people are 0.5% worse off now than they were one year ago, however it really depends what household factors affect each individual household. Let’s take a look at some key areas of the consumer market to see how specific prices are faring in general.
Housing
According to the Land Registry, the average UK house price at the end of November 2016 was £217,928 – which shows an increase of approximately 7% in just under a year. The average monthly rent is up too, from £819 to £839 over the same period of time.
Experts say that the housing market has already started to indicate signs of recovery after an initial period of uncertainty and weakness following the vote for Brexit.
Energy
The cheapest gas and electricity price rate in January 2016 was £765, according to MoneySavingExpert.com. However, the cheapest price in January 2017 was up by around £70, jumping to £834 overall.
This rise has largely come over the past three months, although it was on the horizon for some months prior to this. Raw energy is generally priced in US currency, which makes the pound’s collapse against the dollar particularly significant for large energy providers, and which explains why we’re seeing such a hike in price over a rather brief period of time.
Food
Perhaps a little surprisingly, food prices were in fact down by 1.7% over the previous year, which means the average family is saving about £2.50 on their weekly shop. It may not seem like much, but for a product applicable to us… every little helps, right?
source: http://www.retailtimes.co.uk/brexit-not-impacted-shop-prices-yet-latest-brc-nielsen-index-shows/
Representative 22.93% APRC variable.
For a typical loan of £26,600 over 180 months with a variable interest rate of 19.56% per annum, your monthly repayments would be £484.00. This includes a Product Fee of £2,660.00 (10% of the loan amount) and a Lending Fee* of £763.00, bringing the total repayable amount to £87,030.00. Annual Interest Rates range between 11.7% to 46.5% (variable). Maximum 50.00% APRC. *Lending Fee varies by country: England & Wales £763, Scotland £1,051, Northern Ireland: £1,736.
Think carefully before securing debts against your home may be repossessed if you do not keep up repayments on your mortgage or any other loan secured against it. If you are thinking of consolidating existing borrowing, you should be aware that you may be extending the terms of the debt and increasing the total amount you repay.


